반응형
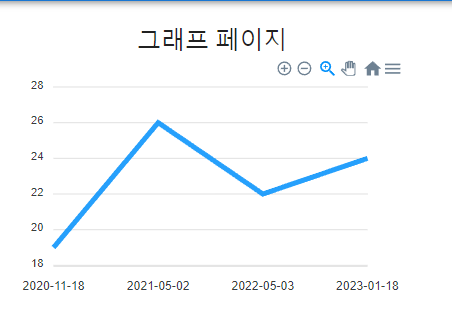
리액트로 그래프를 그리는 일이 생겨 "APEXCHARTS"를 사용하여 차트를 그려보았다.
1. 설치
npm install react-apexcharts apexcharts
2. 코드 사용법
import Chart from "react-apexcharts";
import Typography from '@mui/material/Typography';

const TrainingGraph = () => {
    const series = [
        {
          name: "운동시간(분)",
          data: [19, 26, 22, 24]
        }
      ];
      const options = {
        xaxis: {
          categories: ["2020-11-18", "2021-05-02", "2022-05-03", "2023-01-18"]
        }
      };

    return (
        <div id="chart">
             <Typography component="h1" variant="h5">
        그래프 페이지
      </Typography>
      <Chart type="line" series={series} options={options} />
        </div>
    );
}
export default TrainingGraph;

라이브러리 자체적으로 차트의 영역 확대, 축소, Label Tip 등의 편의 기능을 제공한다.
https://apexcharts.com/react-chart-demos/line-charts/basic/
React Line Chart - Basic Demo – ApexCharts.js
apexcharts.com
반응형
'React' 카테고리의 다른 글
| React firebase push GCM 메시지 전송하기 (0) | 2022.12.24 |
|---|---|
| React Firebase 연동 오류 해결(v8 => v9) (0) | 2022.12.24 |
| [React Err]Module not found: Error: Can't resolve 'web-vitals' (0) | 2022.12.04 |
| [React 설치 중 오류]npm install npm ERR! code ERESOLVE (0) | 2022.12.04 |
| [React]'React' must be in scope when using JSX react/react-in-jsx-scope (0) | 2022.10.11 |